
Fremantle topped the 2026 AFL home-and-away ladder, but Brisbane finished September with the premiership cup. This review keeps those achievements distinct: the complete eighteen-club regular-season table, the new wildcard qualification route and every result in the finals campaign.
The final 2026 home-and-away ladder
Fremantle finished first with nineteen wins and 76 premiership points. Sydney followed on 72, while Brisbane and Hawthorn both reached 64. The complete table below records the finishing order before the finals, including the draws that explain why some clubs with different win totals shared the same points.
This is the men's 2026 home-and-away ladder, taken from the official AFL season data. Its final regular-season snapshot is Round 24, updated after the games on 23 August. Every club played twenty-three matches. A round label is a place in the competition calendar, rather than the number of matches completed by each side.
| Pos | Club | P | W | D | L | Pts | PF | PA | % |
|---|---|---|---|---|---|---|---|---|---|
| 1 | Fremantle | 23 | 19 | 0 | 4 | 76 | 2286 | 1666 | 137.2 |
| 2 | Sydney Swans | 23 | 18 | 0 | 5 | 72 | 2543 | 1869 | 136.1 |
| 3 | Brisbane Lions | 23 | 16 | 0 | 7 | 64 | 2499 | 2054 | 121.7 |
| 4 | Hawthorn | 23 | 15 | 2 | 6 | 64 | 2260 | 1881 | 120.1 |
| 5 | Geelong Cats | 23 | 15 | 0 | 8 | 60 | 2355 | 1925 | 122.3 |
| 6 | Adelaide Crows | 23 | 15 | 0 | 8 | 60 | 2169 | 1849 | 117.3 |
| 7 | Melbourne | 23 | 15 | 0 | 8 | 60 | 2301 | 2099 | 109.6 |
| 8 | Western Bulldogs | 23 | 13 | 1 | 9 | 54 | 1901 | 1992 | 95.4 |
| 9 | Collingwood | 23 | 12 | 2 | 9 | 52 | 2021 | 1974 | 102.4 |
| 10 | Carlton | 23 | 12 | 1 | 10 | 50 | 2007 | 1978 | 101.5 |
| 11 | St Kilda | 23 | 10 | 0 | 13 | 40 | 2030 | 1974 | 102.8 |
| 12 | GWS GIANTS | 23 | 10 | 0 | 13 | 40 | 2073 | 2095 | 98.9 |
| 13 | Gold Coast SUNS | 23 | 9 | 0 | 14 | 36 | 2011 | 2128 | 94.5 |
| 14 | North Melbourne | 23 | 9 | 0 | 14 | 36 | 1932 | 2175 | 88.8 |
| 15 | Port Adelaide | 23 | 7 | 0 | 16 | 28 | 1804 | 2048 | 88.1 |
| 16 | West Coast Eagles | 23 | 4 | 0 | 19 | 16 | 1615 | 2333 | 69.2 |
| 17 | Richmond | 23 | 3 | 0 | 20 | 12 | 1483 | 2373 | 62.5 |
| 18 | Essendon | 23 | 2 | 0 | 21 | 8 | 1601 | 2478 | 64.6 |
P means matches played; W, D and L mean wins, draws and losses. Pts is premiership points. PF and PA are the football points scored and conceded across those matches, with percentage shown to one decimal place. Keeping both kinds of points visible prevents a common mistake: the score kicked during a match and the reward for its result do different jobs.
Under the 2026 regulations, an ordinary win earns four premiership points and a draw earns two. A loss or bye earns none. The table ranks clubs by premiership points, using percentage to separate equal totals. The later finals decide the premier; they do not add another four points to this home-and-away record.
The eighteen records account for 207 matches: 204 decisive games and three draws. The competition's combined points for and points against both total 36,891. Those checks matter because a missing draw or a finals result accidentally included in one club's line can make an archive look convincing while changing its meaning.
Use this table when asking where a club qualified or comparing its scoring over the regular season. Use the finals results further below when asking how far it progressed afterwards. A club can hold a lower August position and still eliminate a higher-ranked opponent in September. Preserving that distinction lets the two stages tell their own part of the season's story.
What separated the top four
Fremantle's first place was built on winning more games than anybody else. Nineteen victories put the Dockers four premiership points ahead of Sydney. Their lead did not depend on a percentage tie-break. The Round 23 win over Adelaide, 112–88 at Optus Stadium, secured the club's second minor premiership and its first since 2015.
The final scoring totals show two different strengths near the top. Sydney scored the most points in the competition, 2,543; Fremantle conceded the fewest, 1,666. Those are season outcomes, rather than a complete explanation of either team's tactics. They do establish that finishing first and producing the largest attacking total were different achievements in 2026.
Brisbane and Hawthorn provide the clearest reason to retain the draw column. The Lions reached 64 points with sixteen wins. The Hawks reached the same total through fifteen wins and two draws: sixty points from wins plus four from the drawn matches. Looking only at wins would miss how Hawthorn stayed level, while treating the draws as losses would understate its qualification record.
Read percentage as a season total
Percentage compares the total scored with the total conceded, multiplied by one hundred. It is not the proportion of matches won, and it is not an average of the percentage from each separate match. Fremantle's calculation is 2,286 divided by 1,666, multiplied by one hundred: approximately 137.2. Sydney's 2,543 divided by 1,869 gives approximately 136.1.
That distinction produces an instructive comparison. Sydney's scoring differential was plus 674, larger than Fremantle's plus 620, yet its percentage was lower. The ratio and the raw difference answer different questions because they use the points conceded differently. Neither number should be quietly substituted for the other when comparing two seasons.
For the Brisbane–Hawthorn tie on premiership points, the Lions' 121.7 percentage put them third ahead of the Hawks' 120.1. But percentage did not move fifth-placed Geelong, at 122.3, above either side: the Cats had sixty premiership points. A better ratio only settles the ranking once the points comparison has left clubs level.
The top four therefore combined two measures of achievement. Winning and drawing supplied the qualification points; scoring relative to opposition supplied the separation where needed. That helps explain the actual order without pretending the ladder alone identifies every favourable match-up. It records the season-long results that earned those clubs their positions before the finals began.
How ten qualifiers became eight finals contenders
Tenth place mattered in 2026 because this was the first season with wildcard finals. The AFL's explanation of the change confirms that the extra round replaced the previous pre-finals bye. The top six rested while seventh to tenth played for the two remaining places in the next stage.
That made the ladder's different boundaries unusually important. Fourth, sixth and tenth each carried a different consequence. Finishing seventh still meant qualifying for official finals, but it no longer meant starting alongside fifth and sixth. Treating every position inside the ten as the same achievement would hide the extra hurdle faced by the lower four qualifiers.
The wildcard matches changed the entry route
Seventh met tenth and eighth met ninth. In the actual 2026 opening weekend, the Bulldogs played Collingwood at the MCG on 28 August, followed by Melbourne against Carlton there on 29 August. The Bulldogs won 96–93; Carlton won 74–55. Collingwood and Melbourne were eliminated.
The survivors were then ranked against each other using their original home-and-away positions. Eighth-placed Western Bulldogs became the higher-ranked wildcard winner and seventh seed; tenth-placed Carlton became eighth seed. Adelaide, sixth on the ladder, therefore faced the Bulldogs, while fifth-placed Geelong faced Carlton. The match number alone did not permanently assign either winner to its next opponent.
Melbourne's exit illustrates what the change meant on the field. Its fifteen wins had produced sixty points, ten more than Carlton, yet the wildcard loss ended its campaign. That does not erase the Demons' stronger regular-season return. It shows that qualifying seventh purchased an opportunity to win another match, rather than protection from losing it.
Top-four protection remained a different advantage
The 2026 Final Ten diagram preserves qualifying finals between first and fourth, and second and third. Those winners advance to preliminary finals; the losers continue to semi-finals. Fifth and sixth enter elimination finals, where a loss ends the campaign. Their wildcard-week rest is useful, but it is not a double chance.
For a supporter reading the August table, that distinction explains why a narrow move from fifth into fourth could be more consequential than several percentage points elsewhere. It changed the response to an opening finals defeat. A team outside the four had to keep winning immediately; a qualifying-final participant had a route to recover.
The new opening weekend added two official finals, bringing the campaign to eleven matches. It widened the starting field while leaving substantial rewards for finishing higher. The results should therefore be read with the ladder position attached: who entered early, who rested and who retained another chance after a defeat.
Every result in the 2026 finals campaign
The campaign ran from the wildcard matches on 28–29 August to the Grand Final on 26 September. The table includes all eleven matches, with goals, behinds and total points retained so that the result can be read independently of the winning margin. The named home side is listed first; that designation does not mean every match took place at its usual club ground.
Each result links to its official match centre. The scores and dates were also checked against the AFL's season-specific match records. A label such as First Preliminary Final is a bracket designation, not a guarantee that it was played before the Second Preliminary Final: Sydney–Fremantle occurred on the Friday, with Hawthorn–Brisbane on the Saturday.
| Date | Final | Venue | Home score | Away score | Margin |
|---|---|---|---|---|---|
| 28 August | Second Wildcard Final | MCG | Western Bulldogs 14.12 (96) | Collingwood 14.9 (93) | 3 |
| 29 August | First Wildcard Final | MCG | Melbourne 7.13 (55) | Carlton 10.14 (74) | 19 |
| 3 September | First Qualifying Final | Optus Stadium | Fremantle 5.10 (40) | Hawthorn 10.12 (72) | 32 |
| 4 September | First Elimination Final | MCG | Geelong Cats 14.23 (107) | Carlton 11.8 (74) | 33 |
| 5 September | Second Qualifying Final | SCG | Sydney Swans 21.15 (141) | Brisbane Lions 13.10 (88) | 53 |
| 5 September | Second Elimination Final | Adelaide Oval | Adelaide Crows 14.6 (90) | Western Bulldogs 9.14 (68) | 22 |
| 11 September | First Semi Final | Optus Stadium | Fremantle 18.12 (120) | Geelong Cats 16.10 (106) | 14 |
| 12 September | Second Semi Final | Gabba | Brisbane Lions 21.18 (144) | Adelaide Crows 13.13 (91) | 53 |
| 18 September | Second Preliminary Final | SCG | Sydney Swans 10.11 (71) | Fremantle 12.11 (83) | 12 |
| 19 September | First Preliminary Final | MCG | Hawthorn 19.8 (122) | Brisbane Lions 20.11 (131) | 9 |
| 26 September | Grand Final | MCG | Fremantle 12.17 (89) | Brisbane Lions 14.12 (96) | 7 |
The qualifying finals dramatically changed the immediate prospects of the eventual Grand Final opponents. Fremantle lost by 32 points to Hawthorn at Optus Stadium. Brisbane lost by 53 points to Sydney at the SCG. Neither defeat ended the losing club's season, because both had earned the top-four route described above.
The semi-finals then supplied two different recoveries. Fremantle beat Geelong by fourteen points in a contest the official report credits Luke Jackson with influencing through twenty-five disposals, thirty-five hitouts and two goals. Brisbane beat Adelaide by 53 points. The margins show how different those immediate tests were; they do not make either preliminary final automatic.
In that next round, both qualifying-final winners were eliminated. Fremantle won by twelve at the SCG, and Brisbane won by nine at the MCG. The two clubs that had needed their second chance reached the decider, while the two that had advanced directly to preliminary finals fell one match short. It is a particularly clear example of the protection being useful without making the subsequent route easy.
Both wildcard winners, meanwhile, lost their elimination finals: Carlton to Geelong and the Bulldogs to Adelaide. That records what happened in the new system's first edition. It does not prove that playing the additional match caused those defeats. The useful conclusion is narrower: a successful wildcard kept a club alive for another week, while the higher ladder positions shaped the next opponents and the available recovery paths.
What the Grand Final settled
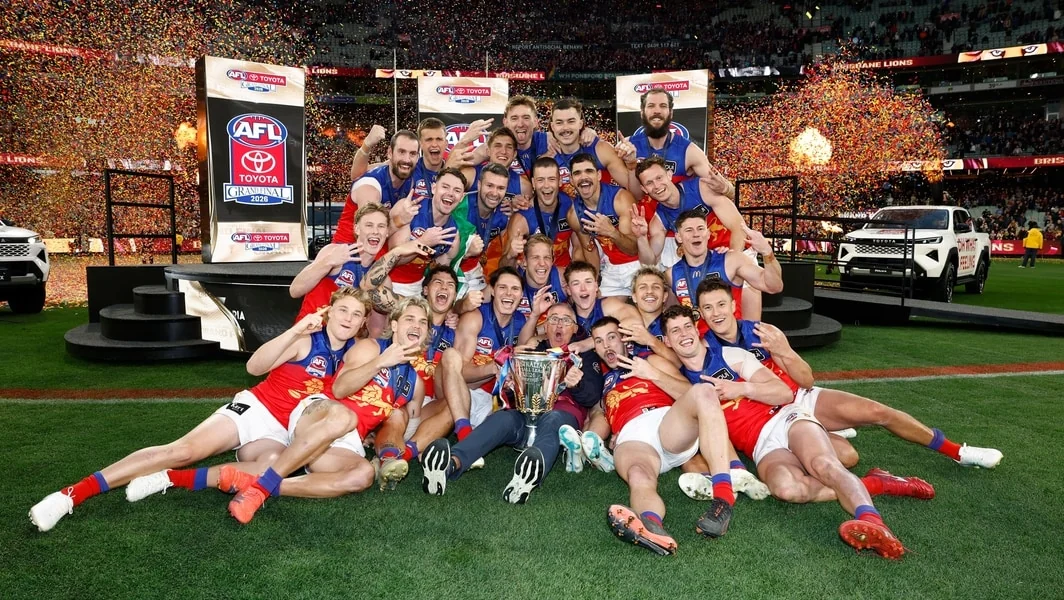
Brisbane won the premiership by seven points, 14.12 (96) to Fremantle's 12.17 (89), at the MCG on 26 September. The MCC's review records a crowd of 100,023 and a third consecutive title for the Lions. The club had completed another three-peat, matching its run from 2001 to 2003.
The final margin conceals how close Fremantle came to its first premiership. The Dockers led by seventeen points with fewer than five minutes remaining. The official match report records Brisbane kicking the last four goals, through Charlie Cameron, Zac Bailey and two from Logan Morris. The last two turned Morris from a player having a quiet day into the scorer who put Brisbane ahead and then sealed the result.
The quarter totals help place that late sequence in the whole match. Scores were level at 43 at half-time. Fremantle led 72–62 at the last change, but Brisbane added 5.4, or 34 points, in the final term against the Dockers' 2.5, or seventeen. That seventeen-point quarter differential turned a ten-point deficit into the seven-point winning margin.
The final score also explains why counting scoring entries alone would be misleading. Fremantle's twelve goals and seventeen behinds produced less than Brisbane's fourteen goals and twelve behinds. Two extra goals were worth twelve points; five additional Fremantle behinds reduced the difference to seven. That arithmetic does not mean every behind was an equivalent missed chance, or that converting one would have left everything else unchanged.
Separate the premiership from the minor premiership
Fremantle's nineteen-win season still made it the minor premier. Brisbane's sixteen-win season had placed it third. September then settled a different contest: which qualifying club could complete the finals route and win the decider. The Grand Final result does not require rewriting the August table with Brisbane artificially moved to first.
Both achievements belong in a season review. Fremantle earned the strongest regular-season record and recovered from a qualifying-final loss to reach the decider. Brisbane also recovered from a qualifying-final defeat, then won three consecutive knockout matches to take the cup. Removing either stage would make the eventual result harder to understand.
Individual recognition supplies another distinction. The official Norm Smith voting awarded Shai Bolton ten votes, ahead of Dayne Zorko and Will Ashcroft on six each. Bolton won best on ground while playing for the losing side. The medal, the premiership and the ladder lead answer three separate questions about performance, and 2026 placed them with different recipients.
What the rest of the ladder still tells us
The first club outside the ten was St Kilda, with forty premiership points. Carlton's fifty left a ten-point gap to the final qualifying place. The Saints had a better percentage, 102.8 against Carlton's 101.5, but the gap was in results rather than the tie-break. A small percentage improvement alone could not have bridged it.
St Kilda also finished with a positive scoring differential: 2,030 for and 1,974 against, or plus 56. Carlton's differential was only plus 29. Yet the Blues won twelve games and drew one, against the Saints' ten wins. Scoring more than the opposition across the whole season is useful evidence of competitiveness, but the wins and draws still have to occur in individual matches.
The Giants shared St Kilda's ten-win, thirteen-loss record and forty points. Their 98.9 percentage placed them twelfth behind the Saints. Gold Coast and North Melbourne formed another equal-points pair on 36, with the Suns' 94.5 ahead of the Kangaroos' 88.8. These were actual percentage tie-breaks, unlike the boundary between Carlton and St Kilda.
North Melbourne and Port Adelaide show why even a scoring differential needs the results beside it. North finished minus 243 and Port minus 244, almost identical season-long differences, but the Kangaroos had nine wins to Port's seven. The resulting eight-point gap was substantial on the ladder. The near-equal differentials cannot tell us how those scores were distributed between wins and losses without looking at the individual games.
At the bottom, West Coast's four wins put it above Richmond's three and Essendon's two. The scoring deficits were large: minus 718 for the Eagles, minus 890 for the Tigers and minus 877 for the Bombers. Essendon's 64.6 percentage was higher than Richmond's 62.5, but it did not outweigh the missing win. Again, the position follows the points before the ratio.
The underlying totals also identify different problems to investigate. Richmond scored the fewest points, 1,483; Essendon conceded the most, 2,478. Those totals describe the outcomes over twenty-three matches. Explaining how they arose would require match and personnel evidence, rather than assuming that every lower-ranked club struggled in the same way.
For comparisons with the following draw, our fixture difficulty analysis explains how previous finishing positions can be used as a historical baseline. Here, the complete 2026 record remains the point: Fremantle led the home-and-away season, ten clubs entered finals, and Brisbane won the premiership. Keeping the points, the tie-breaks and the knockout results separate gives each club's finish its proper meaning.
Join the conversation
Share a question or a thought about AFL. Comments are reviewed before they appear. Keep it friendly and on topic.
No comments yet. Start the conversation.
Sign in with Google to leave a comment. Your email address is not displayed.